


Weekly Market and Position Check
Markets Edge Higher, but Geopolitics Keep One Foot on the Brake


Happy Fathers day!
Last week, we talked about June being a seasonally weak month, and a potential time to give back some of the gains in the indexes.

Markets opened the week on solid footing, with the S&P 500 closing above the 6,000 mark for the first time since last fall—a psychological milestone that helped fuel a broader risk-on mood.
A steady May jobs report (139,000 added, unemployment at 4.2%) and signs of easing U.S.–China trade tensions gave investors more reason to stay constructive, while bond markets offered a quiet vote of confidence: the 10-year Treasury yield drifted down to 4.36% by Friday. With inflation trending lower and the Fed expected to hold rates steady in June, traders continued to price in a growing chance of rate cuts by September. Meanwhile, earnings season wrapped with another strong quarter: 13.4% blended EPS growth and nearly 80% of companies beating expectations, underscoring the resilience of corporate profits even as monetary policy stays restrictive.
But optimism took a hit late in the week as geopolitical tensions flared. Israel’s strike on Iranian nuclear sites and Tehran’s drone response rattled markets on Friday, dragging the S&P down 1.1% and sending oil prices sharply higher. Brent crude surged nearly 7% on concerns over potential disruptions in the Strait of Hormuz, while volatility spiked and investors rotated into defensive names. While the pullback wasn’t enough to erase the week’s early gains, it was a clear reminder that geopolitics remain a key risk.
Heading into next week, the focus will shift back to the Fed’s June meeting, but markets will also be watching for any signs of escalation in the Middle East that could impact energy prices, supply chains, and global growth expectations.
The question everyone is asking is - is the bull run over?

I’d say we should treat this as a normal dip for now until the price action says otherwise. As I mentioned earlier - the market tends to do well until August and then those three months till Oct is when traders specifically should avoid too much trading, large positioning, and have hedges on. Long term traders should have some cash on hand to buy the dip.
Index Check
On the S&P 500 and the Naz, I tend to look at the 2 hour chart for clues dip schedule.
Trend Summary (2-Hour Chart): SPY remains in an uptrend but is showing signs of short-term exhaustion. The price is consolidating just below recent highs near 601.85, holding above the rising 100-period MA (~595), which has served as reliable trend support. However, momentum is weakening: MACD has crossed bearishly, and Williams %R is rolling over from overbought levels. Volume is neutral, with no clear buying pressure on this recent dip. The bull 3x ETF (SPXL) is stalling at resistance while the bear 3x ETF (SPXS) flattens, suggesting potential for a near-term pullback or range.
As long as SPY holds above the 100MA and $593, the broader uptrend remains intact. Traders can look for long entries near $595–596 with a stop under $593, targeting a breakout above 602. If $593 fails, a quick move to $588–585 is likely. Momentum is cooling, so avoid aggressive long exposure until a clear breakout or dip confirmation. A break below $585 would shift the bias short-term bearish.

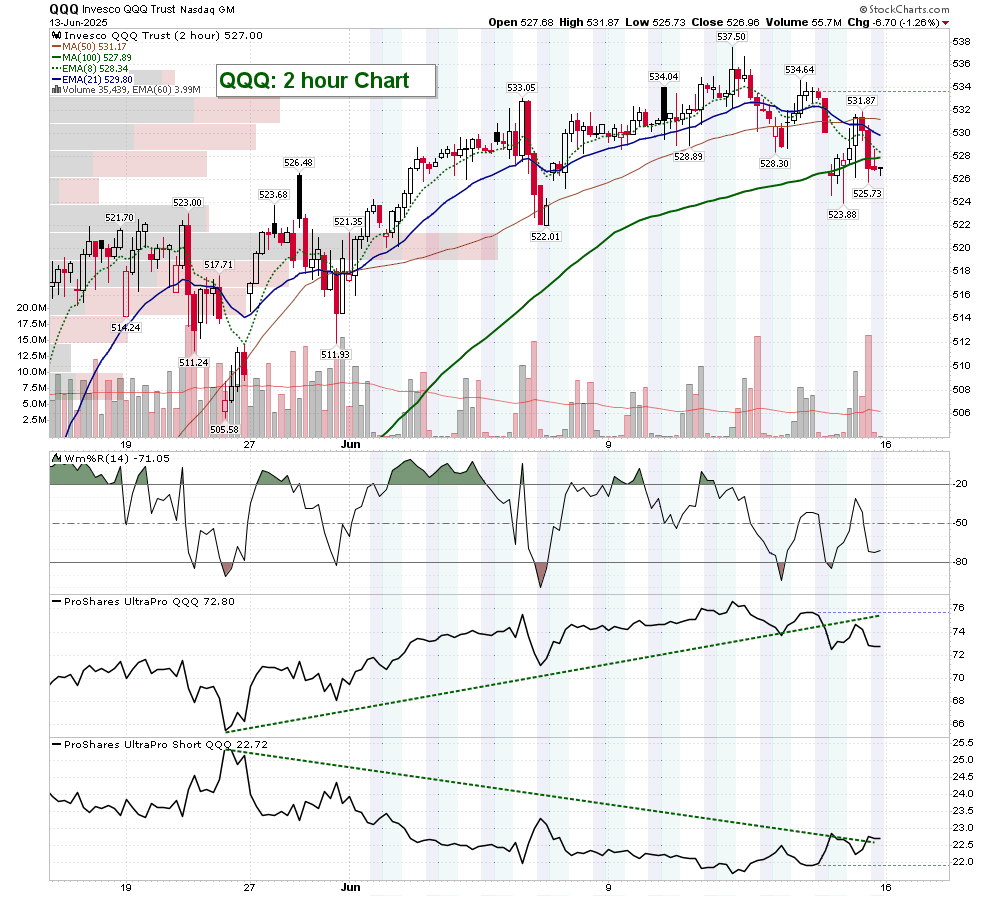
QQQ is in a similar situation as SPY. QQQ is still in an overall uptrend but showing short-term weakness. The price recently lost the 21 EMA and tested below the rising 100-period moving average (~527), with a close just above that support at 526.96. Recent candles show increased selling pressure, and volume has spiked on down moves, indicating distribution. The Williams %R is deep in oversold territory, reflecting bearish momentum. Notably, the leveraged long ETF (TQQQ) is flattening, while the inverse ETF (SQQQ) is starting to trend up, suggesting growing downside pressure.
As long as QQQ holds the $525–527 zone, bulls may attempt a bounce. A reclaim of $531 with strength and volume would put the uptrend back on track. However, a confirmed break below $525 opens room to $520 or even $515, where stronger support lies. Bears may look for short opportunities on failed bounces below the 21/50 EMAs. Momentum has shifted neutral to bearish in the short term—caution is warranted for aggressive long entries until a clear bounce is confirmed.
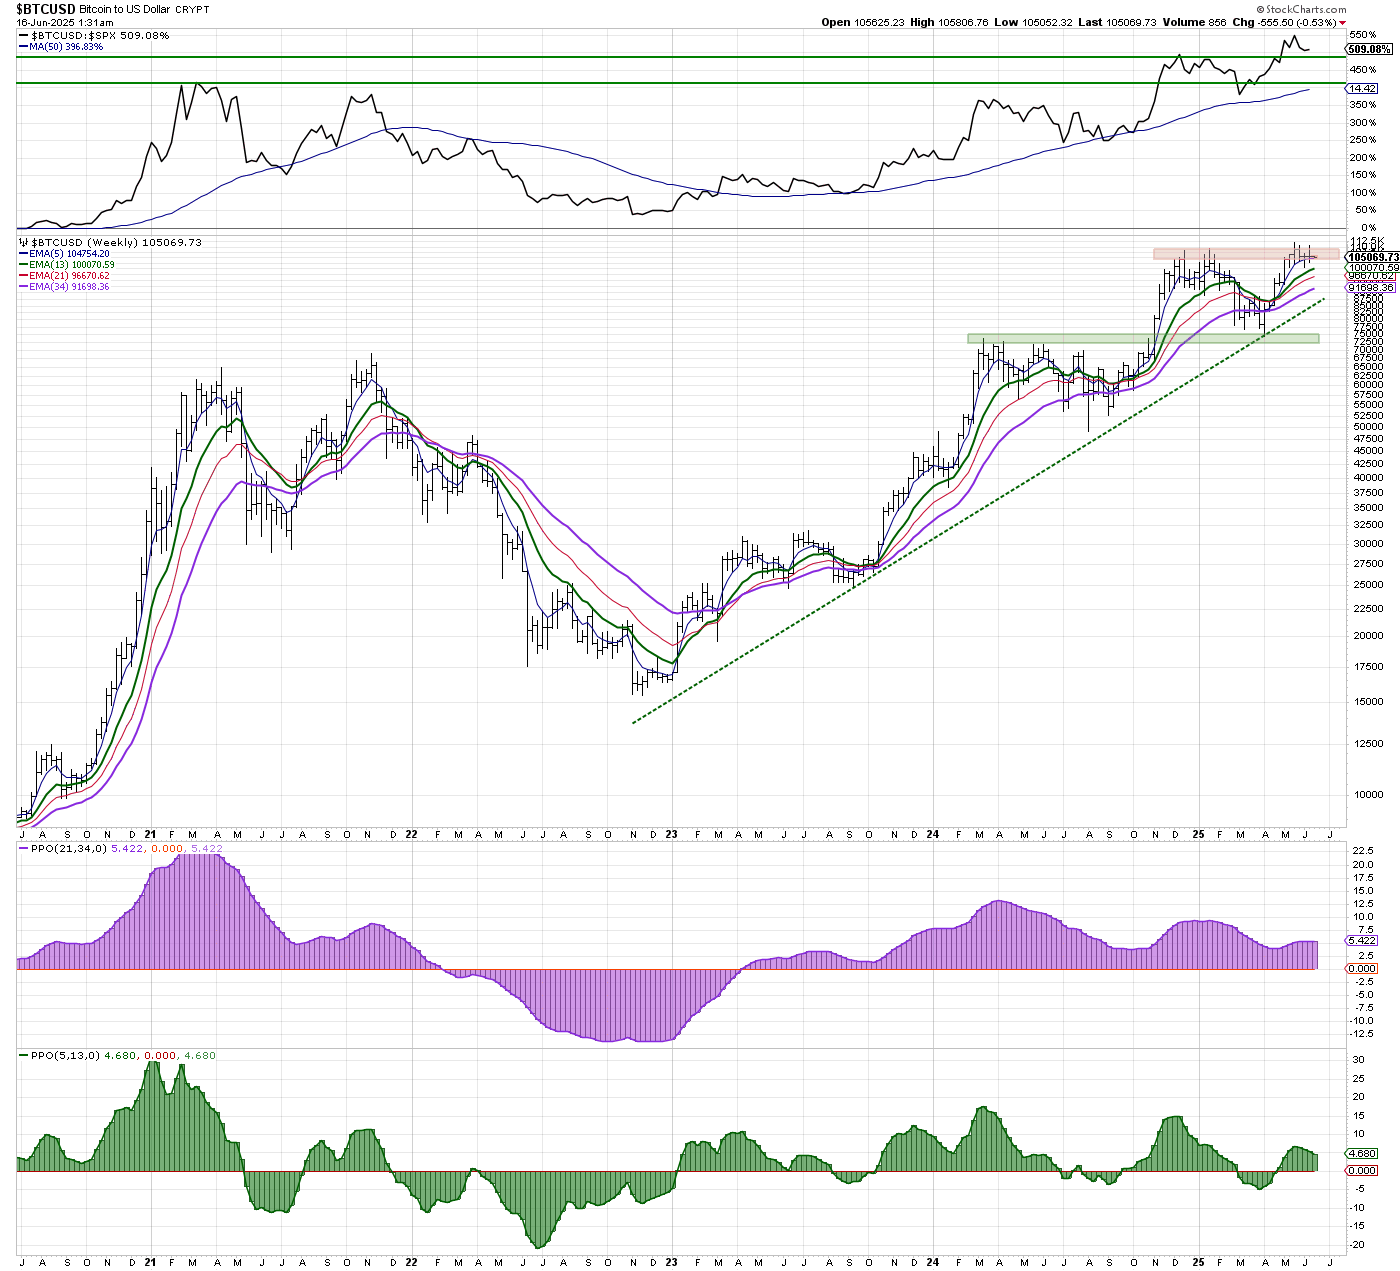
Meanwhile, Bitcoin (BTC) remains in a strong uptrend on both weekly and daily timeframes. The weekly chart shows a well-defined rising trendline from late 2022, with BTC holding above key moving averages and steadily climbing after breaking past the $69K all-time high earlier this year. Recent price action shows a consolidation just under $112K, forming a high base with no major breakdown. On the daily chart, BTC is pulling back slightly from recent highs but continues to trade above the 50- and 200-day moving averages. MACD is softening, suggesting a pause, not a reversal.
The current consolidation offers a potential base for the next leg higher. A breakout above $112K would likely target $120K+. Traders can look for entries near $102–104K on dips or wait for a confirmed breakout over $110.5K. A close below $100K would be a short-term warning, with $95K as the next support zone. As long as the rising trendline and major EMAs hold, the bull trend remains intact.

SMA AI Insights market rating (Ultra Aggressive Trader)
This dashboard and ratings explanation is taken from our new SMA AI Insights Platform, now available to all. Subscribe now for access to 2600+ Stocks, detailed market reviews,
AI Screeners and more!
https://seattlemarketanalytics.ai/

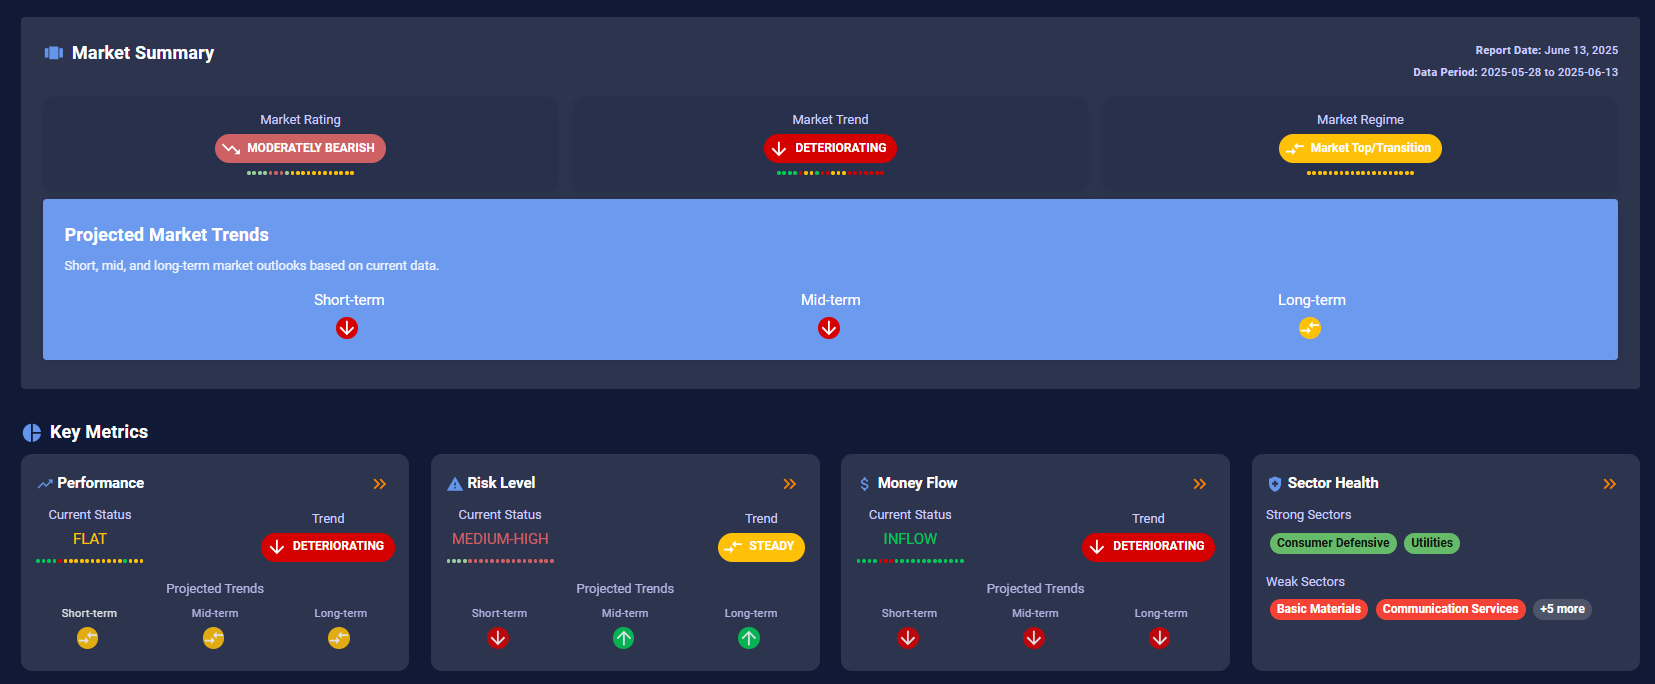
AI Rating Summary
The market has turned "Moderately Bearish" with a "Deteriorating" trend due to rising tensions between Israel and Iran, a significant shift from yesterday's "Neutral" outlook. Money flow is weakening, risk is high, and performance is negative, so we're recommending a defensive strategy.
Here's what we're seeing:
Conflicting Signals: Money is still flowing in, but performance is down, possibly indicating a "bear trap." Be careful of quick rallies.
Defensive Shift: Investors are moving into safer sectors (Consumer Staples, Utilities), but even these are looking shaky. Focus on very short-term trades.
Mixed Outlook: Short-term risks are rising across the board, but mid- to long-term views are still somewhat positive. This could mean chances to buy undervalued assets if you're quick and can handle risk.
What's Driving This:
The main issue is the growing conflict between Israel and Iran, which is causing market instability and pushing investors to safer options. Higher oil prices are also adding to the problem.
What to Do:
Expect more short term volatility in the market.
Look for undervalued assets that could bounce back strongly.
Keep a close watch on geopolitical events and economic news to predict market changes.
Rating explanation The overall market is BEARISH and DETERIORATING, driven by today's loss of 1.225%. This confirms the weakening money flow and elevated risk levels. The short-term and mid-term projected trends are negative, while the long-term trend is expected to stabilize, but this is not a reason to be complacent.
Sector Check

XLE (Energy) stands out as the top performer, surging in the Improving quadrant with strong momentum and relative strength, indicating a short-term trend that could evolve into leadership. XLV (Healthcare) and XLB (Materials) are also on the upswing, positioned firmly in the Improving quadrant, suggesting emerging strength and potential long-side opportunity.
Conversely, XLF (Financials), XLY (Consumer Discretionary), and XLI (Industrials) remain deep in the Lagging quadrant and continue to deteriorate, signaling they should be avoided for now. XLP (Consumer Staples) and XLU (Utilities), often safe havens during volatility, are surprisingly slipping backward, implying defensive sectors are losing their edge despite recent macro tensions.
XLK (Technology) has just rotated into the Weakening quadrant, hinting at potential consolidation or loss of leadership in the short term.
In short, stay selective: lean into Energy, Healthcare, and Materials for potential upside, while reducing exposure to Financials, Discretionary, and Industrials, which continue to underperform relative to the broader market.
Position Check
We tend to bring up new positions on the substack chat during the week. This week given all the new folks joining, I’m updating our current positions and watchlist. Read careful in prep for the week ahead.
Tesla (Ticker: TSLA) (current position via TSLL)
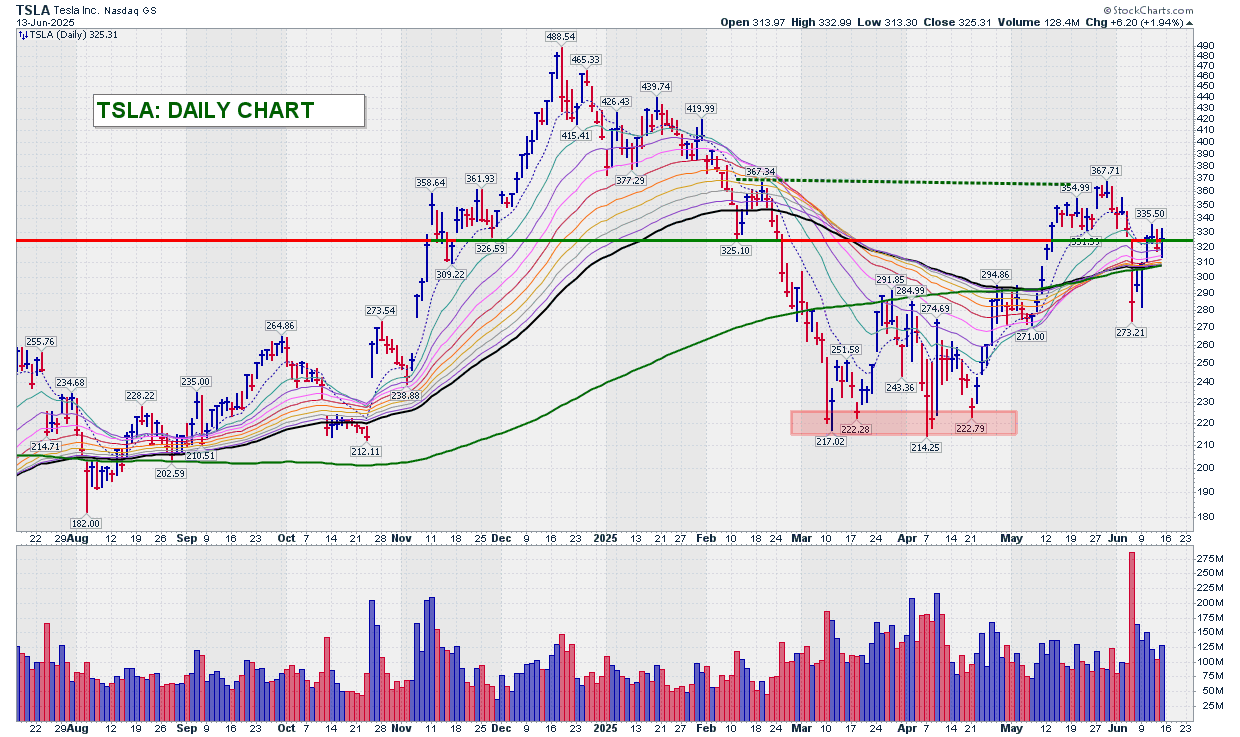
Trend Summary (Monthly & Daily Charts): Tesla (TSLA) is still in a long-term basing phase, not yet in confirmed breakout territory. On the monthly chart, TSLA continues to form a large ascending triangle just below major horizontal resistance around the $350–360 level. While the rising trendline and EMAs are supportive, the stock needs a decisive monthly close above that resistance to confirm a breakout. The PPO is curling higher, hinting at improving momentum, but has not broken out of its long-term downtrend yet.
On the daily chart, TSLA has reclaimed the 200-day moving average and is forming higher lows, with resistance now firmly defined around $335–337. The recent push above $325 is constructive, but the larger breakout level remains overhead.
Trade Plan: TSLA remains a base-in-progress. A confirmed breakout above $335–340 with strong volume would shift the monthly structure into Stage 2, targeting $390–400+. Until then, traders can look to accumulate on dips near $310–320 with a stop below $300, or wait for a breakout retest entry. A failure below $273 would invalidate the current base structure and shift the outlook neutral to bearish.

Coinbase Global (Ticker COIN): Holding long via CONL Puts
Trend Summary (Daily Chart): Coinbase (COIN) recently broke out above a long-term downtrend line and its 200-day moving average, signaling a shift in momentum after a prolonged decline. The stock rallied strongly to $277 before pulling back in a controlled flag-like consolidation around the $240 level. All key moving averages have turned upward and are tightly stacked—a bullish alignment. Volume spiked on the breakout in May, then declined during the pullback, suggesting healthy consolidation. MACD is flattening but still above zero, indicating momentum has cooled but not reversed.
Keep reading with a 7-day free trial
Subscribe to Trading Thoughts with LCC007 to keep reading this post and get 7 days of free access to the full post archives.